Table of Contents
- Summary
- Market Categories and Deployment Types
- Key Criteria Comparison
- GigaOm Radar
- Vendor Insights
- Analyst’s Take
- Methodology
- About Ron Williams
- About GigaOm
- Copyright
1. Summary
Bespoke applications are the backbone of technology-enabled businesses. However, the increasing complexity of modern applications places pressure on IT operations monitoring teams to ensure these applications are running properly. Today’s applications may execute in on-premises infrastructure or public or private cloud environments, with SaaS applications, in low-code/no-code environments, and in various combinations.
Moreover, with the additional emphasis on DevOps, developers are now a part of the operations landscape and must have the tools they need to participate. Developers must handle the application code complexity as well as the use of virtualized and as-code infrastructure. Application performance management (APM) tools and solutions are able to respond to this need, offering insights to both IT operations staff and development teams. These tools must handle a much more complex environment that now includes both operations personnel and developers as well as citizen programmers.
Current APM solutions often interact with the code via code injection or an application agent. These full-stack solutions provide detailed insights in the actual code responsible for generating metrics and other observations.
Many APM solutions have been folded into observability tools, moving the needle from monitoring to observability and eventually to awareness. Organizational awareness requires the monitoring and observability of IT systems and applications. The relationships among monitoring, observability, and awareness (MOA) are shown in Figure 1. MOA refers to the process by which data about operations (IT) and business (people and processes) is tracked and evaluated to enable a company to develop organizational awareness.
- Monitoring provides the state of a single system (or service) and metrics about it (performance or a break/fix condition).
- Observability looks at the state of multiple systems and asks additional questions about the health of these systems as a whole (such as why devices, systems, or applications are behaving a certain way within the context of IT).
- Awareness brings together all information about the company to evaluate whether operations (IT) and business (people and processes) are performing in an acceptable way, what is likely to break next, and how to prevent problems before they are monitored or observed.
APM solutions are now situated squarely within the observability space, with some vendors moving toward awareness resulting from the addition of more analytical tooling using AI.
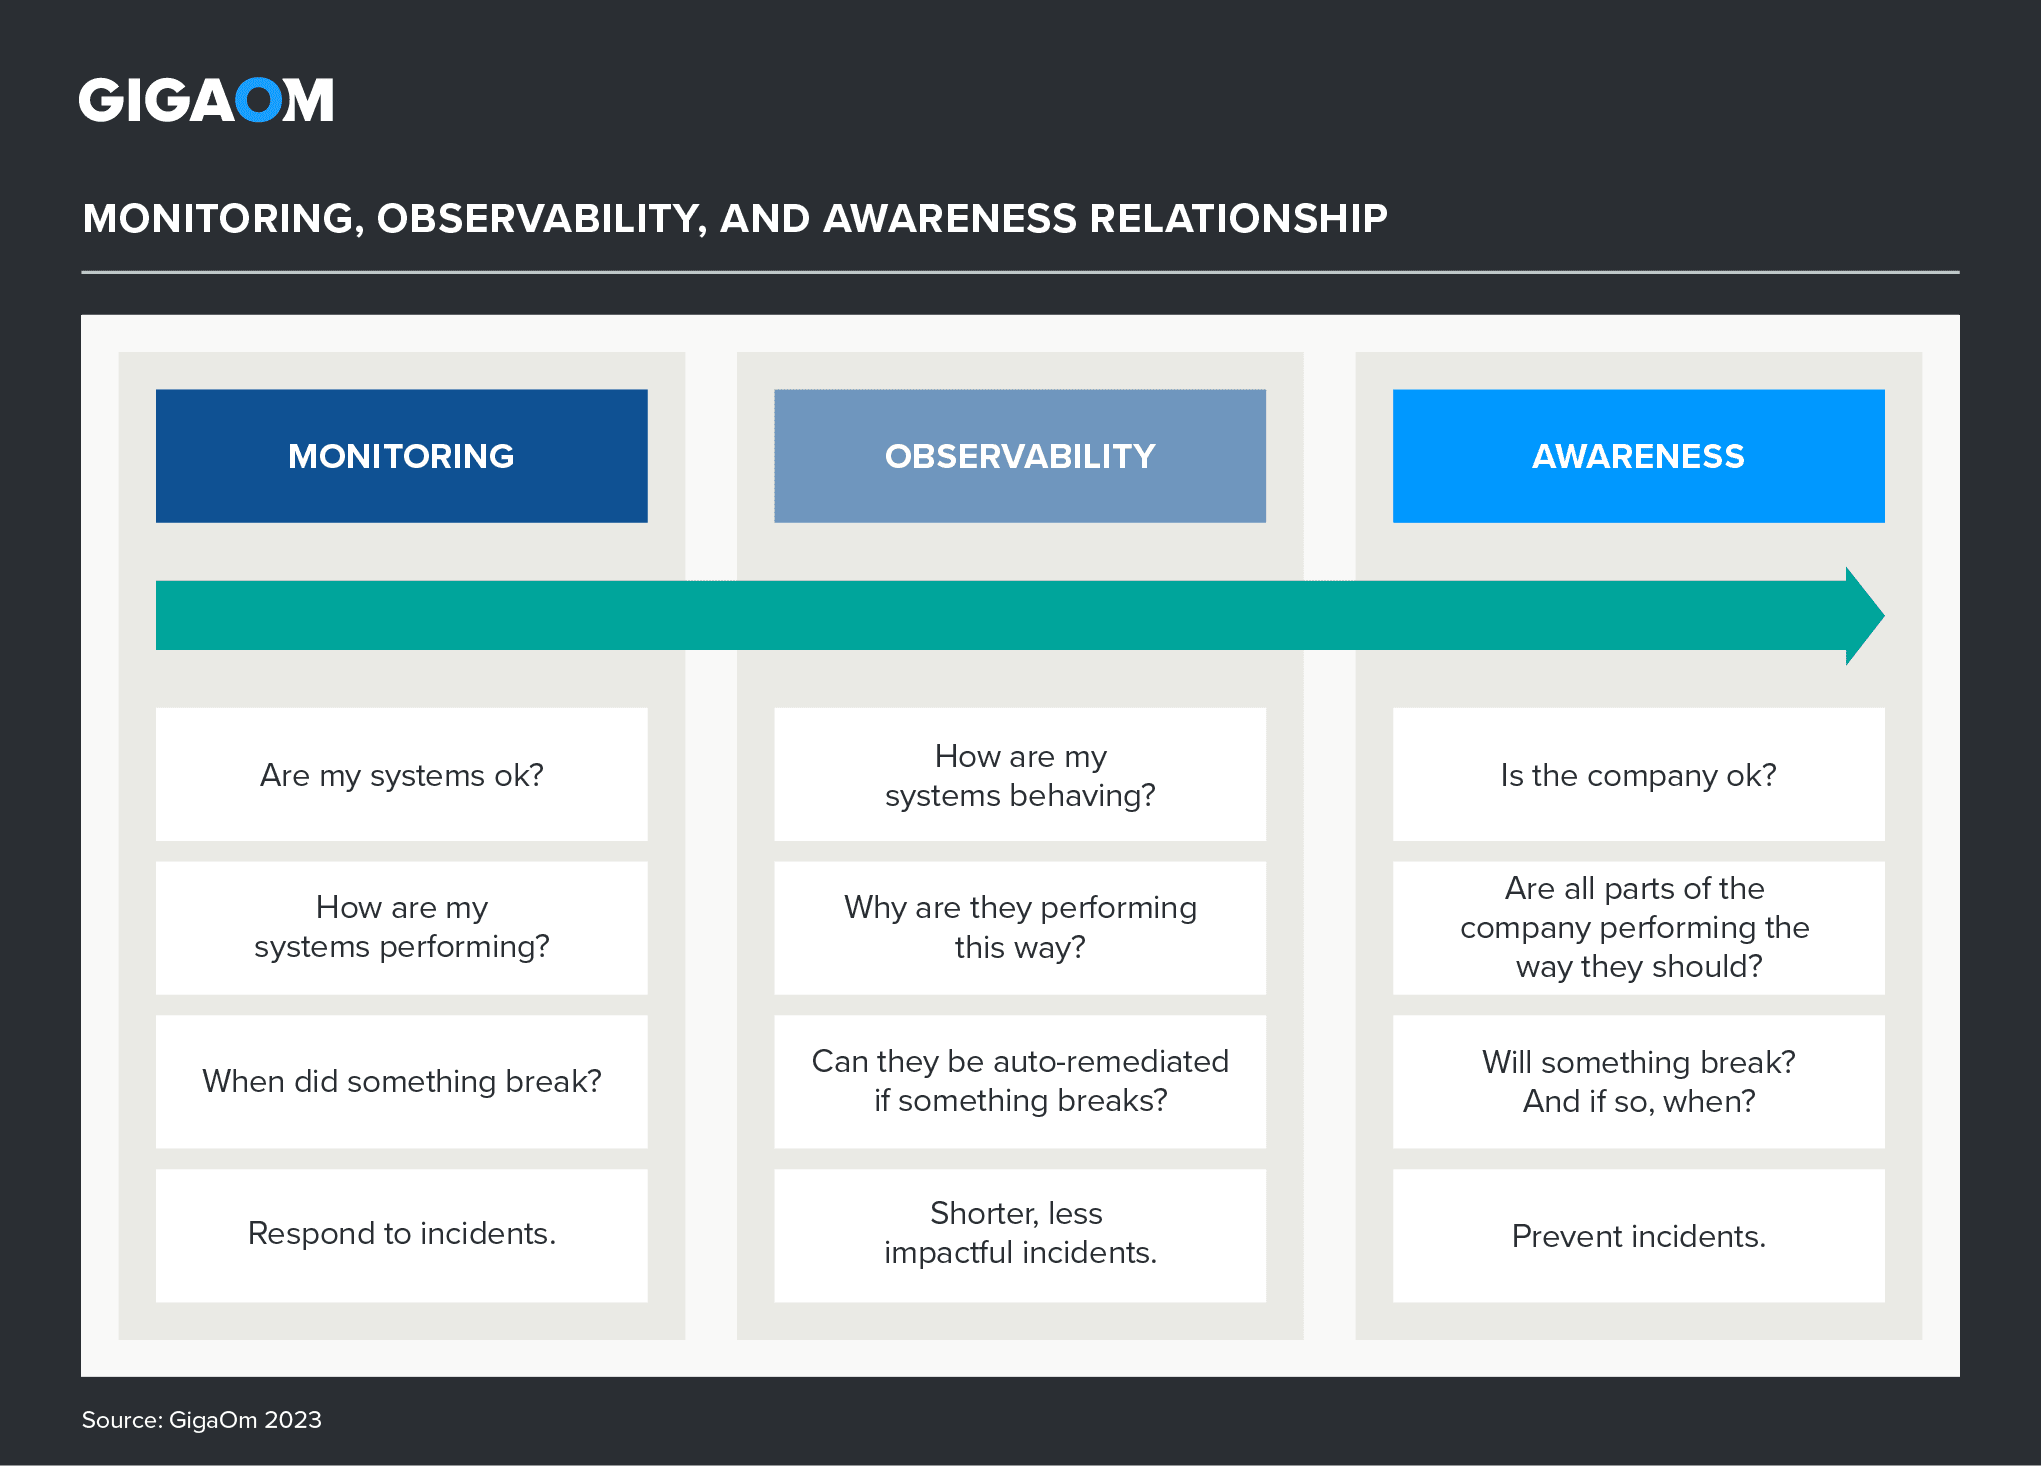
Figure 1. Monitoring, Observability, and Awareness Relationship
This GigaOm Radar report highlights key APM vendors and equips IT decision-makers with the information needed to select the best fit for their business and use case requirements. In the corresponding GigaOm report “Key Criteria for Evaluating APM Solutions,” we describe in more detail the capabilities and metrics that are used to evaluate vendors in this market.
This is our second year evaluating the APM space in the context of our Key Criteria and Radar reports. This is our second year evaluating the APM space in the context of our Key Criteria and Radar reports. This report builds on our previous analysis and considers how the market has evolved over the last year.
All solutions included in this Radar report meet the following table stakes—capabilities widely adopted and well implemented in the sector:
- Application metrics and availability
- Infrastructure discovery and monitoring
- Transaction traceability and monitoring
- User experience (UX) monitoring
- Access controls
Inside the GigaOm Radar
The GigaOm Radar weighs each vendor’s execution, roadmap, and ability to innovate to plot solutions along two axes, each set as opposing pairs. On the Y axis, Maturity recognizes solution stability, strength of ecosystem, and a conservative stance, while Innovation highlights technical innovation and a more aggressive approach. On the X axis, Feature Play connotes a narrow focus on niche or cutting-edge functionality, while Platform Play displays a broader platform focus and commitment to a comprehensive feature set.
The closer to center a solution sits, the better its execution and value, with top performers occupying the inner Leaders circle. The centermost circle is almost always empty, reserved for highly mature and consolidated markets that lack space for further innovation.
The GigaOm Radar offers a forward-looking assessment, plotting the current and projected position of each solution over a 12- to 18-month window. Arrows indicate travel based on strategy and pace of innovation, with vendors designated as Forward Movers, Fast Movers, or Outperformers based on their rate of progression.
Note that the Radar excludes vendor market share as a metric. The focus is on forward-looking analysis that emphasizes the value of innovation and differentiation over incumbent market position.